Colors
We want to use colors to highlight the important pattern we're trying to show with our charts. In the image below your eyes will automatically be drawn to the 3 dark red bars which are the noise complaints.
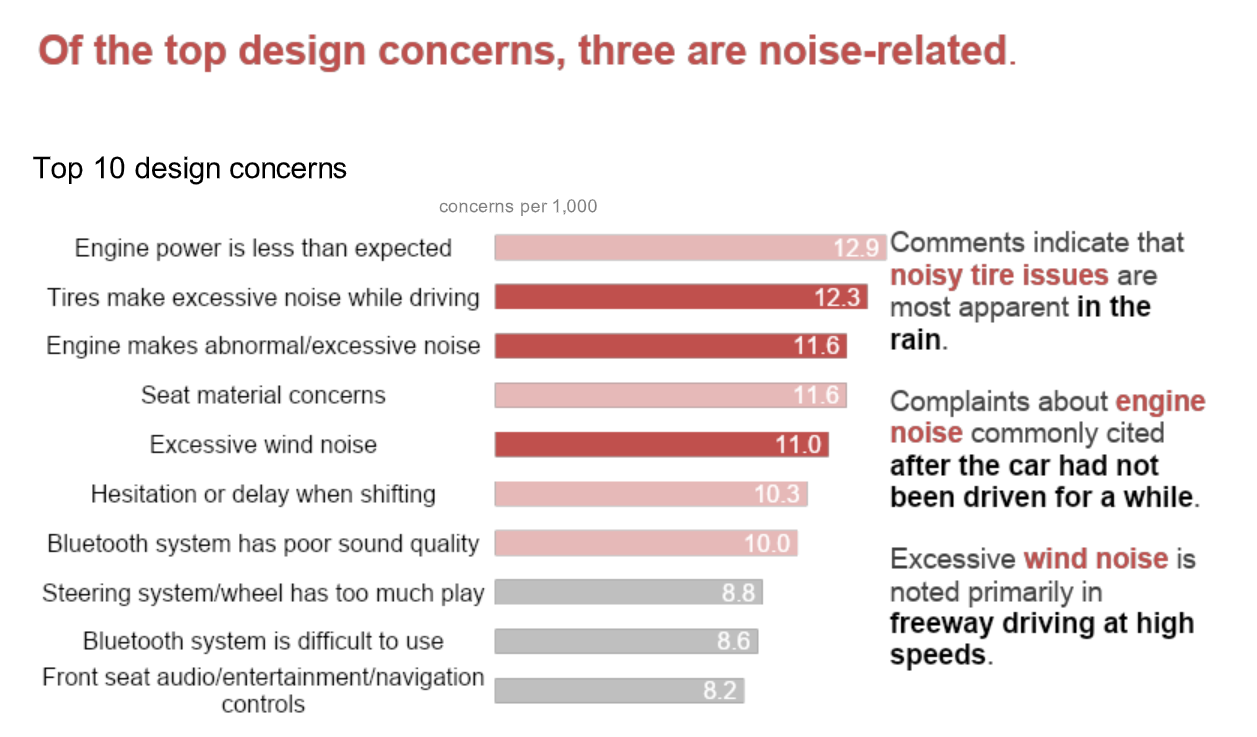
The entire point of this chart is to show the noise complaints so this use of color is effective in highlighting this pattern.
Grays
In plots where we want to gray out bars or lines, this gray color looks nice. Plus, it's easy to remember, it's just "d3" 3 times.
#d3d3d3
#adadad
Categories
If you only need 1 or two colors, always use a blue because it generally looks good.
#4e79a7
#f28e2c
#e15759
#76b7b2
#59a14f
#edc949
#af7aa1
#ff9da7
#9c755f
#bab0ab
We can import the color scheme, from the 'd3-scale-chromatic' package.
import { schemeTableau10 } from 'd3-scale-chromatic';console.log(schemeTableau10) // array of hex codes for colors above ^
We can also setup a scale to keep track of which color goes with each category.
import { scaleOrdinal } from 'd3-scale';const colorScale = scaleOrdinal().range(schemeTableau10);colorScale("category1") // "#4e79a7
Here are other nice colors to use:
#08519C
#005AA3
#D96942
#EDC949
Try to avoid using the light values such as the yellow or pink unless you have a lot of categories. Don't use a blue and yellow that look like UCSB colors together if the data is not from/about UCSB.
If we need to change the color for a bar/text/arrow it's very difficult to look through code and know which hex codes to change.
Please use objects to give hex codes labels and keep in them in one place. If you are using a blue and orange from the list above, create an object such as:
const colors = {blue: "#4e79a7",red: "#f28e2c"}
or category names such as:
const colors = {undergrads: "#4e79a7",grads: "#f28e2c"}
And then if you ever want to use that blue you can just give the value:
colors.blue
which will make the code a lot more readable and easier to change colors in the future
Continuous Colors
We can use continuous color scales such as the one below to emphasize the low and high values of continuous data.

The following code creates a scale to use this color scale:
import { interpolateBlues } from 'd3-scale-chromatic';import { scaleSequential } from 'd3-scale';const colorScale = scaleSequential().interpolator(interpolateBlues);colorScale(0) // color code
For more colors you can checkout the d3 scale-chromatic docs.